Power BI for Data Visualisation

Data is the backbone of modern business operations. Organisations generate massive amounts of information from sales, marketing, operations, and customer interactions every day.
However, raw data alone cannot drive informed decisions; it must be analysed, structured, and visualised effectively. In this article, we will explore Power BI for Data Visualisation, including its features, benefits, real-world applications, and AI capabilities, showing how it helps professionals turn complex datasets into actionable insights.
Power BI empowers users to create interactive dashboards and reports, enabling stakeholders to quickly understand trends, monitor performance, and make informed data-driven decisions.
By using Power BI, organisations can bridge the gap between raw data and actionable insights, improving collaboration, boosting efficiency, and enabling smarter decisions across all business functions.
What is Power BI?
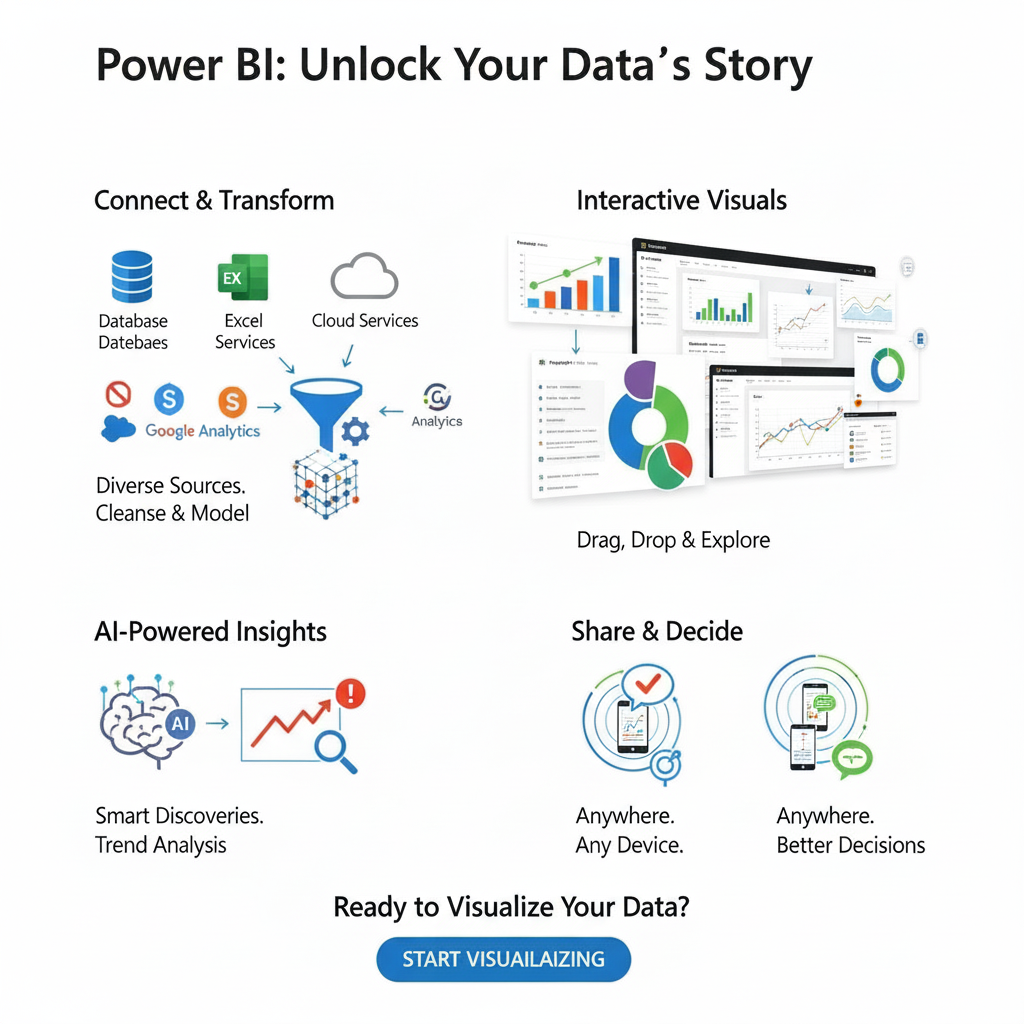
Power BI is Microsoft’s business analytics platform designed to turn complex data into meaningful, interactive visualisations. It enables users to integrate data from multiple sources, including databases, spreadsheets, and cloud services, to create reports and dashboards that are easy to understand.
Power BI consists of several key components:
|
Power BI Component |
Purpose |
Key Feature |
|
Power BI Desktop |
Report creation |
Build interactive dashboards and visualisations locally |
|
Power BI Service |
Cloud sharing & collaboration |
Share reports, collaborate online, schedule refreshes |
|
Power BI Mobile |
Access on the go |
View dashboards and reports anytime, anywhere |
|
Power BI Report Server |
On-premises report management |
Host and manage reports within your organisation |
Let’s explore the key features that make Power BI a preferred tool for businesses worldwide.
Key Features of Power BI
Power BI offers a wide range of features that make data analysis and visualisation simpler and more effective. Its interactive dashboards enable users to explore data dynamically and gain insights in real-time. The platform provides powerful data modelling and transformation tools, enabling users to clean, shape, and merge data from different sources.
With real-time analytics, businesses can monitor performance metrics as events occur. Additionally, Power BI supports custom visuals and natural language queries, making it easy to communicate insights and answer business questions quickly. Its ability to integrate with numerous data sources makes it versatile for multiple industries.
- Interactive Dashboards: Build dynamic dashboards that update automatically.
- Data Modelling and Transformation: Clean and shape raw data efficiently.
- Real-Time Analytics: Monitor key performance metrics instantly.
- Custom Visuals: Represent data in ways that suit your audience.
- Integration with Multiple Data Sources: Connect to databases, spreadsheets, and cloud apps.
- Natural Language Queries: Generate visual reports by asking questions in plain English.
Know more about Data Engineer vs Data Scientist: Understanding the Key Differences.
Benefits of Using Power BI
Power BI offers numerous advantages that enable organisations to make data-driven decisions. Converting raw data into actionable insights allows businesses to plan strategically and optimise operations. Dashboards and reports can be shared seamlessly across teams, fostering collaboration and transparency.
Its intuitive interface and automation features save time and reduce operational costs. By visualising trends, patterns, and key metrics, companies can make informed decisions quickly, helping them maintain a competitive edge.
Furthermore, Power BI promotes a culture of data-driven thinking, enabling employees at all levels to base decisions on reliable evidence rather than intuition.
- Enhanced Decision-Making: Gain actionable insights for strategy planning.
- Improved Collaboration: Share dashboards across teams effortlessly.
- Time and Cost Efficiency: Automate reporting and reduce manual effort.
- User-Friendly Interface: Accessible for both technical and non-technical users.
- Data-Driven Culture: Encourage decisions based on data, not assumptions.
Get insights on Quantitative Analyst Vs Data Scientist: What’s the Difference?
Applications of Power BI
Power BI is highly versatile, making it applicable across various business functions and industries. Organisations use it for business intelligence, enabling them to gain insights into operational performance and trends. Sales and marketing teams leverage Power BI to track campaigns, analyse customer behaviour, and optimise strategies.
Financial teams automate reporting, monitor revenue, and forecast budgets. Operations departments use it to track KPIs and improve workflow efficiency. Additionally, Power BI helps organisations understand customer trends and engagement patterns, leading to better decision-making and improved service delivery. Its adaptability makes it a vital tool for any data-driven enterprise.
- Business Intelligence: Gain insights into operations and performance metrics.
- Sales and Marketing Analytics: Optimise campaigns and track customer behaviour.
- Financial Reporting: Automate reports and forecast budgets accurately.
- Operational Performance Tracking: Monitor KPIs and improve workflow efficiency.
- Customer Insights: Analyse trends and engagement for better decision-making.
Power BI vs Other Tools
While tools like Tableau and Excel are popular for visualisation, Power BI offers unique advantages that make it a preferred choice for many organisations. Its seamless integration with Microsoft products, such as Excel, Azure, and Teams, allows for smooth workflows. Power BI is cost-effective, with a free desktop version and affordable subscription plans.
It also features built-in AI capabilities, including predictive analytics, automated insights, and natural language processing. Furthermore, Power BI’s drag-and-drop interface makes creating complex visualisations simple, reducing the learning curve and empowering non-technical users to work confidently with data.
- Seamless Microsoft Integration: Works smoothly with Excel, Azure, and Teams.
- Cost-Effective: Affordable options for businesses of all sizes.
- AI-Powered Analytics: Predictive analytics and automated insights.
- Ease of Use: Simplifies visualisation creation with an intuitive interface.
Read more – What are the key features of a Data Science course suitable for beginners?
Power BI and AI Capabilities
Power BI extends beyond visualisation by incorporating artificial intelligence, enabling organisations to gain deeper insights from their data. AI-powered features include forecasting, which predicts future trends based on historical data, and key influencer analysis, which identifies factors driving outcomes.
Integration with Microsoft Cognitive Services allows text analytics, sentiment analysis, and image recognition directly within Power BI reports. Automated insights highlight patterns, anomalies, and opportunities without manual analysis.
These AI capabilities enable businesses to make proactive, informed decisions, providing a competitive advantage in a data-driven marketplace and preparing professionals for advanced analytics roles.
- Data Forecasting: Predict trends using historical data.
- Key Influencer Analysis: Identify factors impacting business outcomes.
- Cognitive Services Integration: Apply AI models for text, sentiment, and image analytics.
- Automated Insights: Highlight patterns and anomalies automatically.
Conclusion
Power BI is a robust tool for transforming raw data into interactive dashboards, insightful reports, and actionable strategies. By combining visualisation and AI capabilities, it helps professionals make smarter decisions, collaborate effectively, and drive business growth.
For those seeking to enhance their skills, the Digital Regenesys Data Science Certificate Course offers hands-on training in Power BI, practical AI applications, and industry-relevant knowledge. Equip yourself with the expertise to leverage data and AI confidently.
Visit Digital Regenesys to explore the course and take your professional journey to the next level.
Last Updated: 26 September 2025