How to Use Tableau for Data Visualisation?

Organisations generate vast amounts of information from sales, marketing, operations, and customer interactions every day. However, raw data on its own rarely translates into actionable insights without proper analysis and visualisation.
Tableau, a leading data visualisation tool, helps businesses transform complex datasets into interactive and easily understandable visual stories. This article will explore Tableau’s features, benefits, applications, and how it empowers professionals to make informed, data-driven decisions.
With Tableau, professionals can uncover trends and patterns, presenting them visually to stakeholders in real-time, thereby enhancing collaboration and accelerating decision-making.
What is Tableau?
Tableau is a robust business intelligence (BI) and data visualisation tool that converts raw data into interactive visual dashboards. It is widely used across various industries, from finance to healthcare, to interpret large datasets and inform decision-making. Tableau enables users to connect to multiple data sources, including Excel, SQL databases, cloud platforms, and big data systems.
Tableau provides both simplicity and advanced capabilities: beginners can create meaningful dashboards without coding, while data analysts can leverage analytics, calculations, and predictive modelling for deeper insights. Its flexibility makes it suitable for both small businesses and multinational corporations.
Key points about Tableau include:
- Interactive dashboards for intuitive data exploration
- Connectivity with diverse data sources
- Real-time updates and analytics
- Ease of use for non-technical users
Get insights on the Programming Language Used in Data Science.

Types of Tableau
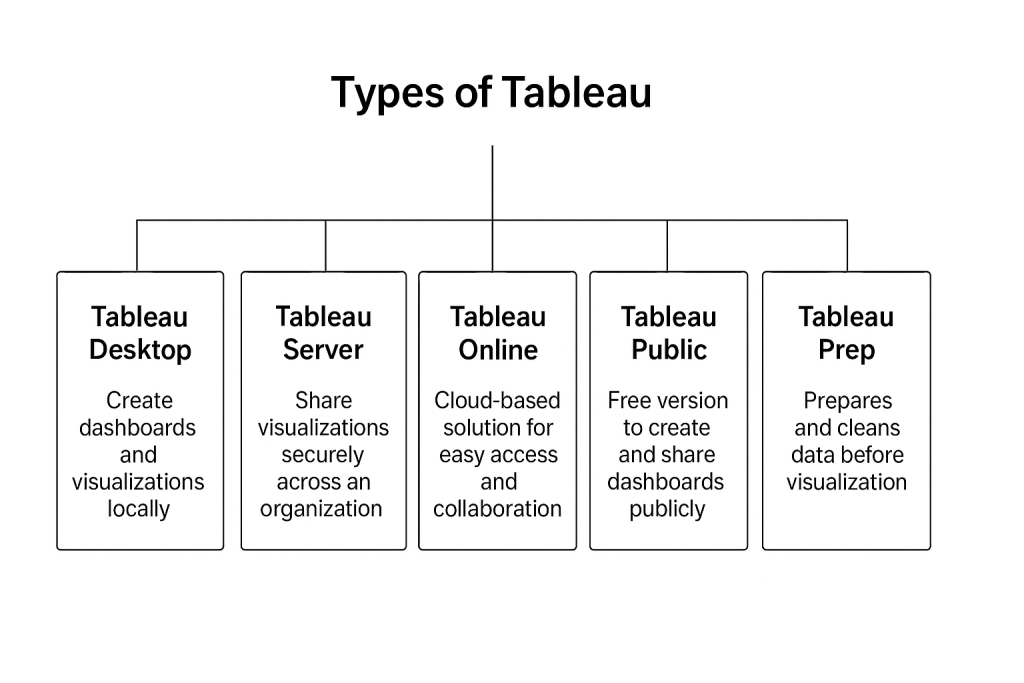
Tableau offers a range of products tailored to various needs. Tableau Desktop allows users to build visualisations locally. Tableau Server and Tableau Online enable the sharing of dashboards across organisations or the cloud. Tableau Public is a free version that allows for the creation of public dashboards. Tableau Prep simplifies data cleaning and preparation.
These options provide users with flexibility, whether they are creating dashboards, collaborating within teams, or publishing insights publicly. Each product is tailored to specific workflow needs, making Tableau versatile for business and personal use.
Different Tableau products cater to various use cases and organisational needs.
Benefits of different Tableau types include:
- Local dashboard creation with Tableau Desktop
- Secure sharing via Tableau Server
- Cloud collaboration using Tableau Online
- Public sharing with Tableau Public
- Efficient data preparation using Tableau Prep
Key Features of Tableau
Tableau’s features make data analysis intuitive, interactive, and insightful. Its drag-and-drop interface allows quick creation of charts, graphs, and dashboards. Real-time data connections ensure dashboards remain current, while advanced analytics and predictive modelling support deep insights. Tableau also enables collaboration, allowing teams to explore and share dashboards securely. These capabilities make it ideal for professionals seeking a balance between ease of use and advanced analytical power, enabling organisations to turn raw data into meaningful visual narratives efficiently.
Notable features include:
- Dynamic and interactive dashboards
- Data blending from multiple sources
- Predictive analytics and statistical modeling
- Collaboration and sharing capabilities
Benefits of Using Tableau
Tableau simplifies complex datasets, enabling organisations to make informed decisions more quickly. Real-time dashboards reduce the need for manual reporting, improving efficiency. Its visual approach uncovers hidden trends and patterns, while collaboration tools allow multiple teams to work on insights simultaneously.
Tableau’s flexibility enables it to be used across various industries, including marketing, finance, healthcare, and education. By turning raw data into actionable intelligence, Tableau empowers professionals to improve performance, optimise processes, and make decisions with confidence.
Key benefits include:
- Simplifies complex datasets for easier understanding
- Enables faster, data-driven decision-making
- Provides real-time insights and trend analysis
- Enhances collaboration and reporting efficiency
- Applicable across multiple industries
Read about Is Data Science Different From Machine Learning.
Tableau Applications Across Industries
Tableau is widely used across industries to visualise data and drive decision-making. Marketing teams analyse campaign performance and customer trends. Finance departments track budgets, expenses, and revenue forecasts. Healthcare organisations monitor patient outcomes and research data.
Educational institutions analyse student performance, while supply chain managers track inventory and logistics. Tableau’s versatility ensures it can meet diverse business needs, making it an essential tool for professionals looking to extract insights and optimise operations across different sectors efficiently.
Common applications include:
- Business performance and KPI tracking
- Marketing analytics and customer trends
- Financial analysis and forecasting
- Healthcare analytics and research data
- Supply chain and logistics monitoring
Tips for Effective Data Visualisation
Effective dashboards require clarity and strategy. Choose chart types that represent data accurately, highlight key insights, and avoid clutter. Apply filters to enhance interactivity and allow stakeholders to explore the data. Use colours, labels, and annotations to emphasise trends or anomalies. Regular updates ensure accuracy, while well-designed dashboards improve comprehension and decision-making. Following best practices in Tableau ensures dashboards are visually appealing, functional, and insightful for business or research applications, making data communication more effective across teams.
Key tips include:
- Choose appropriate chart types for your data
- Keep dashboards simple and focused
- Apply filters for interactivity and exploration
- Highlight key trends and insights
- Update dashboards regularly
Why Tableau Stands Out Among BI Tools
Tableau stands out due to its balance of simplicity and advanced functionality. Its drag-and-drop interface is user-friendly, while predictive analytics and AI integration support complex analysis. Tableau works with multiple data sources and visualisation types, giving users versatility.
Its strong community ensures support, resources, and learning opportunities. Organisations benefit from better insights, faster decisions, and enhanced collaboration. Tableau’s unique combination of usability, flexibility, and analytical power makes it a preferred tool for professionals and businesses seeking actionable insights from complex data.
Reasons Tableau stands out include:
- User-friendly drag-and-drop interface
- Compatibility with diverse data sources
- Advanced analytics and AI integration
- Large, active community for support
Conclusion
Tableau empowers organisations to turn raw data into actionable insights through interactive dashboards and real-time analysis. Its ease of use, flexibility, and advanced analytics make it essential for business intelligence, research, and operations. Professionals who master Tableau can identify trends, optimise processes, and make data-driven decisions confidently.
For professionals seeking to enhance their skills in data visualisation and artificial intelligence, the Digital Regenesys Data Science Certificate Course provides hands-on training with tools such as Tableau, practical AI applications, and industry-relevant skills to make data-driven decisions with confidence.
Visit Digital Regenesys to explore the course and elevate your expertise in AI and data visualisation.
Last Updated: 24 September 2025